In my first NuoDB blog , I explained how to deploy the NuoDB database in a Kubernetes environment using OpenEBS storage. In this post, we will learn how to install the monitoring part: NuoDB Insights
NuoDB Insights is a graphical dashboard that provides users with a detailed view of their NuoDB database. The visual dashboard allows users to understand the performance and overall health of their NuoDB database environment. NuoDB Insights is based on grafana and influxdb.
Prerequisites
Before you get started, you’ll need to have these things:
- A kubernetes cluster (1 master and 3 workers nodes) on linux instance
- Configuration of each node : 16 vCPUs - 32GB RAM - 120 GB of storage
- HELM > 3.0.x
- OpenEBS 1.4.0
- package tuned installed
- NuoDB 4.x installed
Architecture
I will use the following architecture :

Deployment Steps
To deploy NuoDB Insights in Kubernetes, we will use Helm Charts. NuoDB Helm Charts are production ready and fully support day two operational tasks such as backup and restore, continuous upgrade, and can be deployed in multi-cloud and multi-cloud environments.
Add NuoDB Helm Charts repository
$> helm repo add nuodb-insights https://storage.googleapis.com/nuodb-insights
"nuodb-insights" has been added to your repositories
$>
Install the NuoDB Insights chart
$> helm install insights nuodb-insights/insights --namespace nuodb
$>
Verify the pods are running :
$> kubectl get pods -n nuodb |grep insights
NAME                              READY   STATUS    RESTARTS   AGE
insights-grafana-57ff765c78-fsc2w 2/2     Running   0          5m30s
insights-influxdb-0               1/1     Running   0          5m30s
$>
Accessing NuoDB Insights
By default, the NuoDB Insights Grafana dashboard WebUI will be available within the Kubernetes cluster via the ClusterIP service.
$> kubectl get svc -n nuodb|grep insights-grafana
NAME                   TYPE        CLUSTER-IP       EXTERNAL-IP   PORT(S)                        AGE
insights-grafana       ClusterIP   10.96.190.96     <none>        80/TCP                         8m23s
There are more ways to access the WebUI dashboards like:
- using port forwarding and directing your web browser to http://localhost:8080/.
- patch the service by changing the ClusterIP type to NodeIP
- use port forwarding in ssh
- ….
To make it as simple as possible I patch my service and I can access directly from my workstation with the public ip address of one of my cluster nodes (for example the master):
$> kubectl patch svc insights-grafana -p '{"spec": {"type": "NodePort"}}' -n nuodb
service/insights-grafana patched
$>
$> kubectl get svc -n nuodb|grep insights-grafana
NAME TYPE CLUSTER-IP EXTERNAL-IP PORT(S) AGE
insights-grafana NodePort 10.96.190.96 <none> 80:30649/TCP 26mI will access the WebUI dashboards with the public ip address of one of the cluster nodes on port 30649
By default, Grafana generates a random password when the instance is started. To retrieve the password run this command :
$> kubectl get secrets -n nuodb \
$(kubectl get secrets -l app.kubernetes.io/name=grafana -n nuodb -o custom-columns=":metadata.name" --no-headers=true) \
-o jsonpath="{.data.admin-password}" | base64 --decode ; echo
You can login in now with the admin account and the password
Conclusion
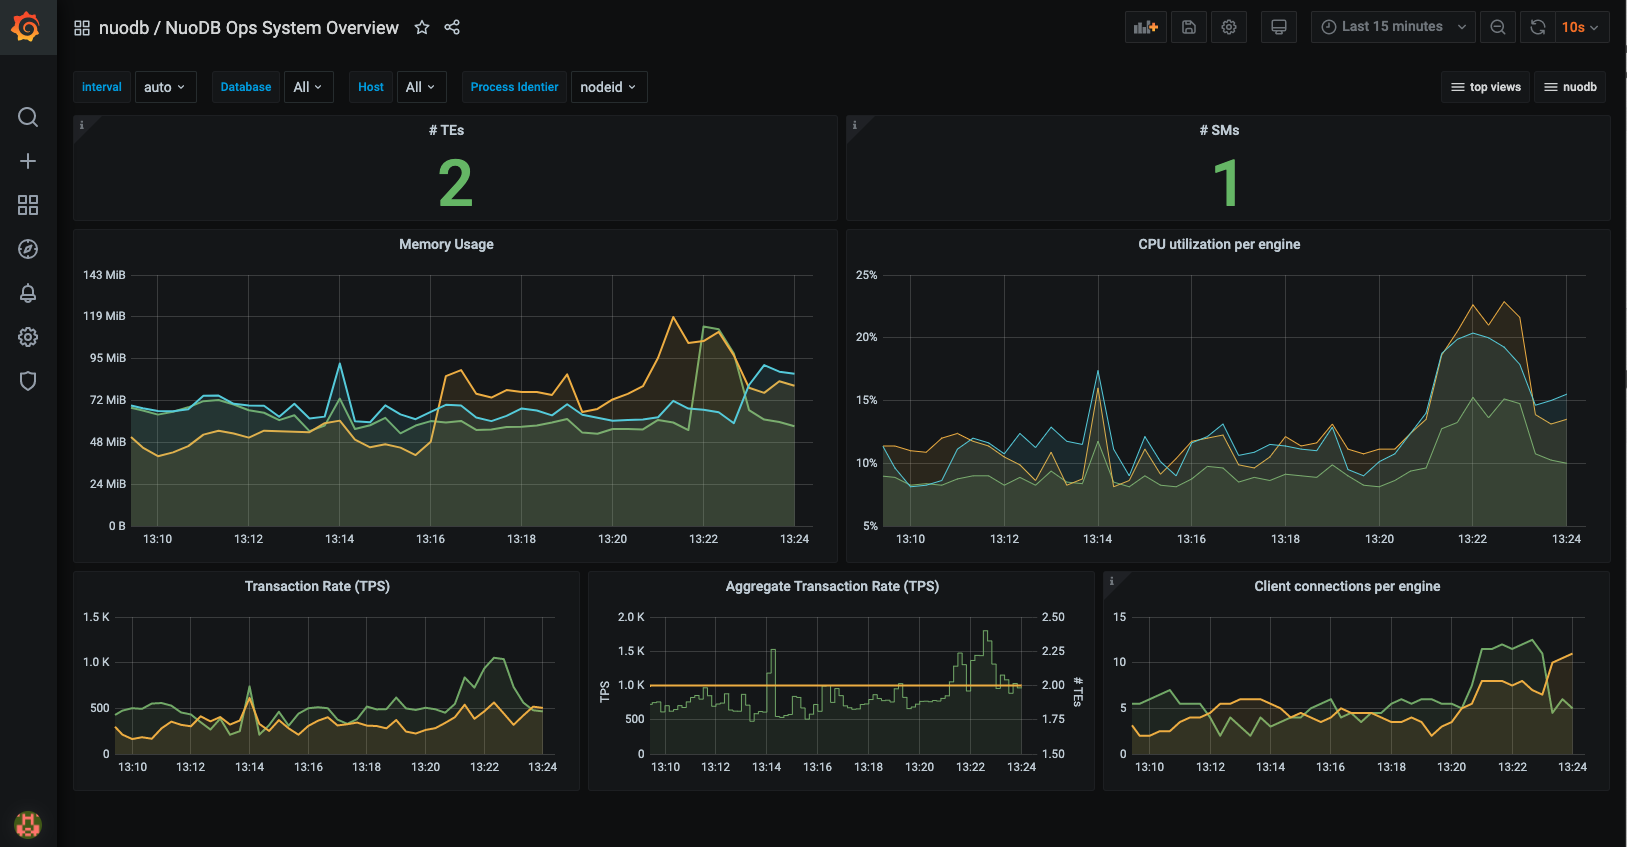
You can now easily monitor your NuoDB database.Different grafana dashboards are delivered. You’ll have access to real-time and historical trend data, including:
- Lifecycle events - start/stop, transaction per second (TPS) timing.
- System configuration data - CPU, memory, disk and network resource utilization, and constraints.
- NuoDB performance data - response times, load averages, number of application connections, and more…
Next Step
Scale-Out, Continuous Availability
 NuoDB Insights Chart